


Insurance Prediction System
Developed an end-to-end Machine Learning regression project to predict individual medical insurance costs based on key customer attributes such as age, BMI, gender, number of children, smoking status, and region.
Among the evaluated models, Gradient Boosting Regressor achieved the best performance, with a Test R² score of 90.09%, MAE of 2,517, and RMSE of 4,268, making it the most effective model for predicting insurance costs in this project.
Gradient Boosting
Regression
Machine Learning
90%
R2 score
0.83
CV R² score
4268
RMSE
Gradient Boosting Regressor was the best-performing machine learning model in the Insurance Cost Prediction project. It is an ensemble learning technique that builds multiple decision trees sequentially, where each new tree focuses on correcting the errors made by the previous trees.
Insurance Prediction System
Developed an end-to-end Machine Learning regression project to predict individual medical insurance costs based on key customer attributes such as age, BMI, gender, number of children, smoking status, and region.
Among the evaluated models, Gradient Boosting Regressor achieved the best performance, with a Test R² score of 90.09%, MAE of 2,517, and RMSE of 4,268, making it the most effective model for predicting insurance costs in this project.
Gradient Boosting
Regression
Machine Learning
90%
R2 score
0.83
CV R² score
4268
RMSE
Gradient Boosting Regressor was the best-performing machine learning model in the Insurance Cost Prediction project. It is an ensemble learning technique that builds multiple decision trees sequentially, where each new tree focuses on correcting the errors made by the previous trees.
Project Description
The Insurance Cost Prediction System is a comprehensive Machine Learning application developed to predict an individual’s medical insurance charges based on demographic and lifestyle-related factors. The project demonstrates a complete machine learning workflow, including data preprocessing, exploratory data analysis, feature encoding, model training, model comparison, evaluation, cross-validation, and prediction on unseen data.
The system analyzes factors such as age, gender, BMI, number of children, smoking status, and region to estimate medical insurance charges. By comparing multiple regression algorithms, the project identifies the model that provides the most reliable predictive performance.
The project is designed for educational, research, and analytical purposes and demonstrates industry-standard practices for developing an end-to-end machine learning regression application.
Problem Statement
Medical insurance costs can vary significantly depending on factors such as age, BMI, smoking habits, family size, and geographical region. Estimating these costs manually can be difficult because multiple factors can influence the final insurance charge simultaneously.
The challenge is to develop a data-driven machine learning system capable of analyzing multiple customer attributes and accurately estimating their medical insurance costs. The system should provide reliable predictions while allowing different regression algorithms to be evaluated and compared.
This project addresses that challenge by building a machine learning application that predicts insurance charges from customer-related information while providing meaningful model evaluation and performance analysis.
Objectives
The primary objectives of this project are:
- Develop a machine learning model capable of predicting individual medical insurance charges.
- Analyze the relationship between demographic, lifestyle, and health-related features and insurance costs.
- Perform comprehensive data preprocessing, cleaning, and feature encoding to improve data quality.
- Conduct exploratory data analysis (EDA) to identify important patterns and relationships in the dataset.
- Compare multiple regression algorithms and select the best-performing model using objective evaluation metrics.
- Evaluate model performance using R² Score, MAE, MSE, RMSE, and cross-validation.
- Analyze training and testing performance to identify potential overfitting or underfitting.
- Apply hyperparameter optimization where appropriate to improve model performance.
- Build a reusable prediction workflow for estimating insurance costs for new customer data.
- Demonstrate a complete end-to-end machine learning pipeline suitable for academic and practical applications.
AI-Powered Insurance Cost Prediction
The Insurance Cost Prediction System uses Machine Learning regression algorithms to estimate medical insurance charges based on customer information such as age, BMI, smoking status, number of children, gender, and region. The system processes the input through a structured preprocessing and prediction pipeline to generate an estimated insurance cost.
Intelligent Data Processing
The application performs the necessary preprocessing before model training and prediction. This includes data cleaning, handling categorical variables through encoding, preparing numerical features, and ensuring that training and prediction data follow a consistent preprocessing workflow.
Multiple Machine Learning Models
Instead of relying on a single algorithm, the system compares several regression models to identify the most effective approach. The evaluated models include:
- Linear Regression
- Ridge Regression
- Lasso Regression
- ElasticNet Regression
- Decision Tree Regressor
- Random Forest Regressor
- Extra Trees Regressor
- Gradient Boosting Regressor
- AdaBoost Regressor
- K-Nearest Neighbors Regressor
- Support Vector Regression
The best-performing model is selected based on the evaluation results.
Performance Evaluation
The project uses industry-standard regression evaluation techniques to measure model performance.
The trained models are evaluated using:
- R² Score
- Mean Absolute Error (MAE)
- Mean Squared Error (MSE)
- Root Mean Squared Error (RMSE)
- Cross-Validation Score
- Training and Testing Performance
- Overfitting Analysis
These metrics provide a comprehensive understanding of prediction accuracy, error magnitude, model consistency, and generalization ability.
Unseen Data Prediction
The trained model can be used to predict insurance charges for new customer information that was not included in the training dataset.
The prediction workflow is:
New Customer Data → Preprocessing → Trained Model → Predicted Insurance Charges
Results
Performance Metrics
The project evaluates regression models using the following metrics:
| Metric | Description |
|---|---|
| Training R² | Measures how well the model fits the training dataset. |
| Testing R² | Measures how accurately the model predicts unseen test data. |
| Cross-Validation R² | Measures average model performance across multiple validation folds. |
| MAE | Measures the average absolute difference between actual and predicted insurance charges. Lower values indicate better performance. |
| MSE | Measures the average squared prediction error. Lower values indicate better performance. |
| RMSE | Measures prediction error while giving greater importance to larger errors. Lower values indicate better performance. |
🏆 Model Performance
Gradient Boosting Regressor achieved the best overall performance among the models evaluated in the Insurance Cost Prediction project.
- Training R²: 0.8916
- Testing R²: 0.9009
- Testing R² Percentage: 90.09%
- Cross-Validation R²: 0.8342
- Mean Absolute Error: 2,517.47
- Root Mean Squared Error: 4,268.28
These results demonstrate that the Gradient Boosting model can explain approximately 90.09% of the variation in insurance charges on the test dataset, while maintaining comparatively low prediction errors.
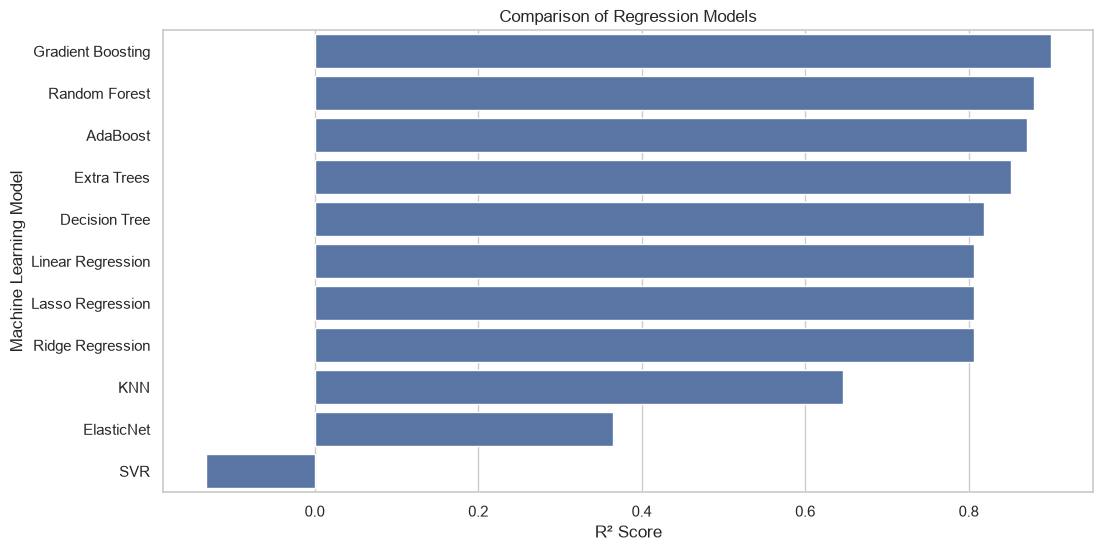
Model Comparision
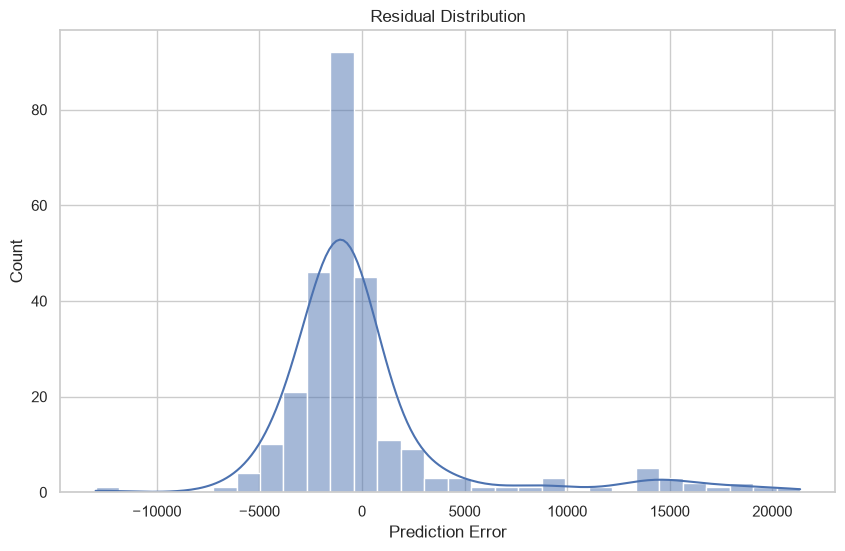
Distribution
Model Comparison — Testing R²
- Gradient Boosting: 90.09%
- Random Forest: 87.99%
- Extra Trees: 87.11%
- AdaBoost: 85.18%
- Decision Tree: 81.94%
- Linear Regression: 80.69%
- Lasso Regression: 80.68%
- Ridge Regression: 80.59%
- KNN: 64.62%
- ElasticNet: 36.49%
- SVR: -13.33%
1. Introduction
The Insurance Cost Prediction System is a Machine Learning-based predictive analytics application designed to estimate medical insurance charges using demographic, lifestyle, and health-related customer information. By analyzing factors such as age, BMI, smoking status, number of children, gender, and region, the system provides data-driven insurance cost predictions.
The project demonstrates a complete end-to-end Machine Learning workflow, from data preprocessing and exploratory analysis to model training, evaluation, cross-validation, model comparison, and prediction on unseen customer data.
2. Objectives
The primary objectives of this project are:
- Predict individual medical insurance charges using Machine Learning.
- Analyze the impact of demographic and lifestyle factors on insurance costs.
- Perform data cleaning, preprocessing, and feature encoding.
- Conduct exploratory data analysis to identify important relationships within the dataset.
- Compare multiple regression algorithms.
- Evaluate models using R², MAE, MSE, RMSE, and cross-validation.
- Identify the best-performing regression model.
- Analyze training and testing performance to detect overfitting.
- Provide an effective prediction workflow for new customer data.
- Demonstrate an end-to-end Machine Learning pipeline.
3. System Overview
The complete workflow of the system consists of:
Data Collection → Exploratory Data Analysis → Data Cleaning → Feature Engineering → Data Preprocessing → Train-Test Split → Model Training → Cross-Validation → Model Evaluation → Model Comparison → Best Model Selection → New Data Prediction
The workflow ensures that the raw insurance dataset is transformed into a format suitable for Machine Learning and that the final model is evaluated before being used for prediction.
4. Technologies Used
| Category | Technology |
|---|---|
| Programming Language | Python |
| Data Analysis | Pandas, NumPy |
| Data Visualization | Matplotlib, Seaborn |
| Machine Learning | Scikit-learn |
| Hyperparameter Tuning | GridSearchCV |
| Model Persistence | Joblib |
| Development Environment | Jupyter Notebook |
| Deployment | Streamlit |
5. Machine Learning Model
The project evaluates multiple regression algorithms, including:
- Linear Regression
- Ridge Regression
- Lasso Regression
- ElasticNet Regression
- Decision Tree Regressor
- Random Forest Regressor
- Extra Trees Regressor
- Gradient Boosting Regressor
- AdaBoost Regressor
- K-Nearest Neighbors Regressor
- Support Vector Regression
The models are compared using Testing R², Cross-Validation performance, MAE, MSE, and RMSE.
Based on the evaluation results, Gradient Boosting Regressor achieved the strongest overall performance.
6. Evaluation Metrics
The model performance is assessed using:
- R² Score — Measures how much of the variation in insurance charges is explained by the model.
- MAE — Measures the average absolute difference between actual and predicted charges.
- MSE — Measures the average squared prediction error.
- RMSE — Measures the typical prediction error while penalizing larger errors more heavily.
- Cross-Validation Score — Evaluates model consistency across different subsets of the training data.
- Training Score — Measures performance on the training dataset.
- Testing Score — Measures performance on unseen test data.
- Overfitting Analysis — Compares training and testing performance to assess generalization.
Because this is a regression problem, metrics such as classification accuracy, precision, recall, and F1-score are not used as the primary evaluation metrics.
7. Conclusion
The Insurance Cost Prediction System successfully demonstrates how Machine Learning can be used to estimate medical insurance charges from customer-related information.
After preprocessing the data and comparing multiple regression algorithms, Gradient Boosting Regressor achieved the best performance with a Testing R² of 90.09%, MAE of 2,517.47, and RMSE of 4,268.28.
The project demonstrates important real-world Machine Learning practices, including data preprocessing, exploratory analysis, feature encoding, model comparison, cross-validation, performance evaluation, and prediction on unseen data.
The modular workflow also provides a strong foundation for future improvements such as advanced hyperparameter tuning, additional feature engineering, model explainability, and deployment as an interactive prediction application.